Thunderbird Developer Tools Wrapup

In my earlier two posts I showed you my work on the Google Summer of Code 2013 Project to bring the Developer Tools to Thunderbird. The method for doing so is making use of Firefox’s remote debugging protocol, allowing to use the web developer tools available in Firefox to manipulate Thunderbird. More details are covered in the earlier posts. The Summer of Code has now come to an end, so I would like to tell you about my progress, the goals I’ve reached and those my mentor and I have decided are out of scope.

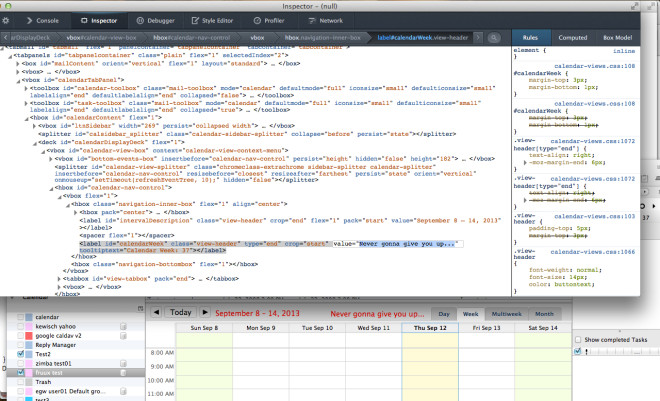
First of all, let me tell you about the remaining features I have implemented since the last post. One of the features is support for the remote inspector. This was pretty easy to do, although support for it is still preliminary. There are still a few quirks, but it’s mostly usable.  You can see here I’ve changed an attribute value:

Devtools Inspector in Action

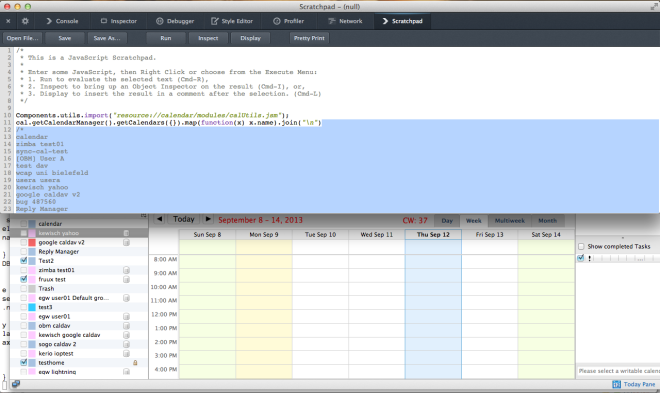
Next up is support for scratchpad, which is still work in progress on the client side but is almost complete. Here is a screenshot:

Devtools Scratchpad in Action

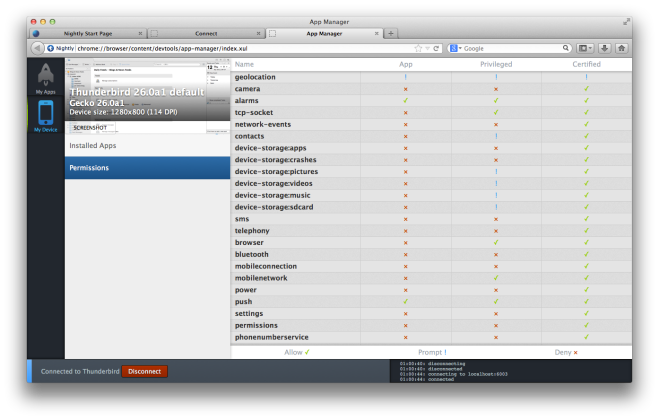
Also, there is the app manager. This is, as far as I’ve understood, still in a beta stadium and aims to be a central place for managing remote devices. Thunderbird is one of these “remote devices”. The app manager shows some information about Thunderbird like its resolution and allows making screenshots:

app-manager

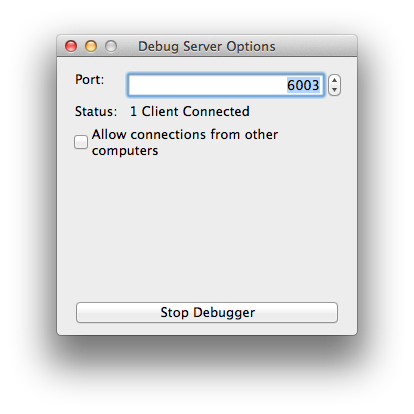
Finally, I’ve made progress packaging the glue code required for the debugger server into an extension. This is mostly a build system change that allows packaging the code as a restartless addon which I can distribute on addons.mozilla.org. The extension has an option dialog which allows starting and stopping the remote connection. From within Thunderbird this extension is not needed, but it is helpful for other applications based on the Mozilla Platform, like those based on XULRunner. I will post an update when the extension is available on addons.mozilla.org. Here is a screenshot of the options dialog:

Devtools Server Extension Dialog in Action

In my original milestone planning there were a few features considered a bonus. Some of these were not completed. It turns out those extra features are a substantial amount of effort, possibly even worth their own Summer of Code Project.

The first of these two is adding a way to inspect IMAP connections in the network monitor. This requires providing a specific interface in the IMAP channel implementation which makes it possible to inspect the content even after the request has been sent. Also, it is needed to mimic certain aspects of a http channel, specifically the concept of request and response headers. In Thunderbird, the IMAP channel implementation is heavily cached. Hooking up the channel interface to the network monitor would cause display of cached requests as separate requests. Also, this would only fix it for IMAP connections. A better way would be to add a general mechanism in the Mozilla Platform to be able to inspect TCP connections. This requires some changes very deep down in the networking platform and is probably not easy to carry out. I have filed a bug to solve this, but it won’t be a part of the Summer of Code.

The next feature that is missing is gcli, also known as the “Developer Toolbar”, that small black bar you can open in the Web Developer menu that allows executing text commands. The problem here is that the code has a lot of dependencies to Firefox code. A substantial amount of files need to be moved from the directory containing Firefox code to a directory common to all XUL applications. Some files also need to be split up.  As this feature is a nice to have, but not considered vital functionality for Thunderbird Developer Tools, we have decided to postpone it. If you see a need for this feature, please leave a comment describing what you want to do with it. In the meanwhile you can follow the bug on bugzilla.

With this I have covered all the features I have proposed, I’d say it was a very successful Summer of Code. I have managed to reduce the code needed in Thunderbird and made most of the changes inside the Developer Tools code. This makes sure that support for Thunderbird will work in the future without needing updates. Also, new remote features will automatically work, given there is no Firefox specific code in them.

If you want to jump right in and try it, I have to appeal to your patience. Some of the patches required for functionality are still in review by my mentor and the Mozilla developer tools team. I will let you know once everything is in place. I’m pretty sure we will able to get all code into the tree by the end of the current cycle.
Thunderbird Style Editor, Web Console, Network Monitor and Profiler

As you can see in my earlier post, I have worked on giving the Firefox developer tools access to Thunderbird using the remote protocol. Ultimately this means you will be able to debug and profile scripts, edit styles, view network traffic and view console messages.

Previously, I was able to make the debugger work, which was the most important feature to my mind. Now that the mid-terms are coming up soon, I thought I’d give you an update on what I have achieved. After fixing a few bugs in the developer tools code, I was able to add the remaining actors needed for the profiler, web console and style editor. The network monitor actually worked out of the box.

The code is not yet reviewed or pushed to the tree, so you cannot test it just yet. To bridge the gap, I’d like to present a few screenshots where you can see its working.

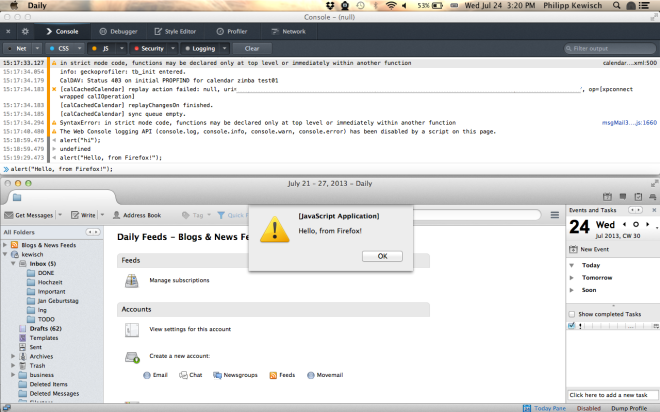
This is the web console in action. As you can see, evaluated JavaScript in the web console in Firefox executes in Thunderbird:Devtools Web Console in Action
 

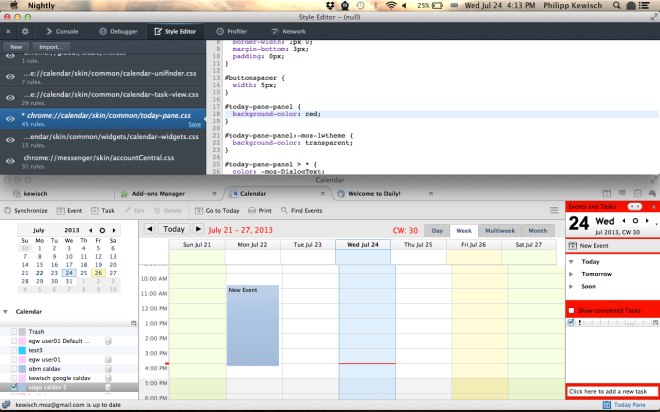
This is the style editor. You can do everything you can do in Firefox: Disable style-sheets, change style rules, or add new ones. Here I’ve changed the #today-pane-panel background color to red:Devtools Style Editor in Action


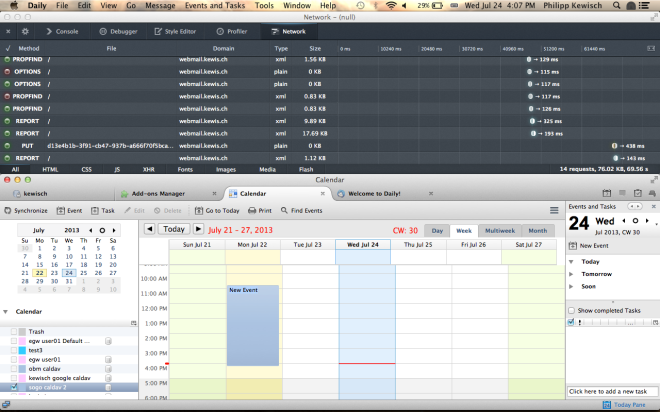
This is the network monitor. You can see the Lightning calendaring extension connecting to a CalDAV server. In this case I have just added the New Event, which sends a PUT request to the server. Pure socket connections like IMAP are not visible yet, but anything that is HTTP will show up. I will be looking into adding socket connections to the network monitor after the midterms:Devtools Network Monitor in Action


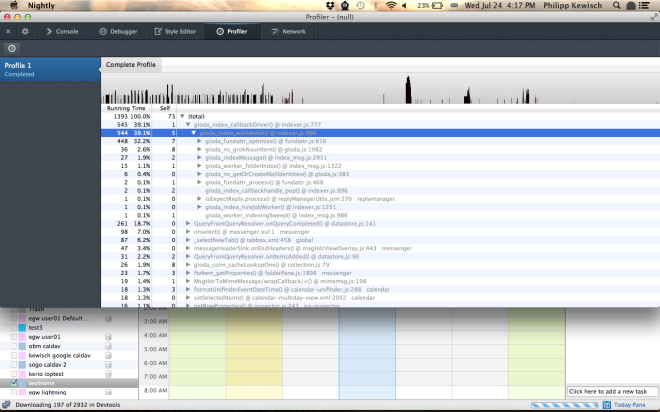
Finally, the profiler in action. I was able to start the profiler in Firefox, then I did some random actions in Thunderbird. The profiler analyzed which functions were executed how often and how long they took and I could inspect the result in Firefox:Devtools Profiler in Action


If you want to track my progress on a more detailed level, head over to this issue on bugzilla and put yourself on the CC list. There you will also see what is left to do. I will add a comment there when the current patches are pushed and usable in the nightly builds.

The Thunderbird (Remote) Debugger is alive!

For quite some time now, I have been forced to use printf-style debugging for any work on the Mozilla Calendar Project. In most cases, its a real pain. Evaluating variables without restarting is so much more comfortable. There used to be Venkman, but due to ongoing “improvements” in the Mozilla Platform and Firefox, Venkman is broken and is no longer doing the job. When support for the first version of the Javascript Debugger interface (JSD1) is removed, that will be the final nail in the coffin of Venkman.

So it looks like we need an alternative. I’ve heard of lots of interest in creating alternatives, but the deal breaker is often the lack of time to actually work on a such project. In the meanwhile, Mozilla is investing time and resources to add native developer tools to Firefox. Maybe there is some way we can make use of these resources? Yes there is! The developer tools team is doing a great job. And by great I mean outstanding. Thanks to Firefox for Android and Firefox OS, the team designed the debugger in a client-server constellation. The Mozilla Platform provides debugger server component that is (almost) free of Firefox-specific code. Then there is the very Firefox specific developer tools client you know from the Firefox Tools Menu.

It became obvious to me that using this debugger server in Thunderbird would be a very future safe method. In contrast to copying the debugger UI into its own extension and make that compatible with Thunderbird, we just need to ensure that the already very general debugger server is kept clean of hardcoded Firefox-isms. For this reason I have applied to the Google Summer of Code as a student to make it happen.

Although the Summer has just started, I am proud to present a first success. With the latest nightly builds of Thunderbird 24.0a1 and a matching Firefox 24.0a1 nightly, its possible to debug Thunderbird code right from in your browser. Here is how:

  1. Download a Firefox nightly build.
  2. Download a Thunderbird nightly build.
  3. Start Thunderbird, select Tools → Allow Remote Debugging
  4. Start Firefox, open about:config, set devtools.debugger.remote-enabled to true and restart Firefox
  5. In Firefox, select Tools → Web Developer → Connect…
  6. Fill in connection details in case you changed anything, otherwise localhost port 6000 should be fine
  7. Now you should get a list with “Main Process”. Click on that

And that’s it! Now switch to the debugger tab in Firefox, and after a short load you will start seeing scripts and can set breakpoints. I will be improving support during the next weeks, so other tools can also be used. Track my progress in bug 876636.

As I’ve used the term “Remote Debugging” more than once in this post and it has already come up on the bugtracker, I will also tell you a little about privacy. It may sound like we are opening doors here so that anyone who might like to connect to your Thunderbird instance can control it. That is not at all true.

First of all, remote debugging is turned off by default. If you don’t do anything about it, then you won’t even notice its there, nor will any attacker. If you do enable remote debugging via the menu, either on purpose or by accident, there is another preference guarding you called devtools.debugger.force-local. The default value for this preference is true, this means that even with “Remote Debugging” enabled, only connections from localhost (i.e your computer) will be accepted. If you decide to circumvent this too by setting that preference to false, there is yet another wall to save you: If a remote debugger attempts to access your computer, you are presented with a dialog to accept, decline or even disable remote debugging. If you decline or disable, no harm is done.

If you have any further concerns regarding privacy, please do comment or contact me.