In my earlier two posts I showed you my work on the Google Summer of Code 2013 Project to bring the Developer Tools to Thunderbird. The method for doing so is making use of Firefox’s remote debugging protocol, allowing to use the web developer tools available in Firefox to manipulate Thunderbird. More details are covered in the earlier posts. The Summer of Code has now come to an end, so I would like to tell you about my progress, the goals I’ve reached and those my mentor and I have decided are out of scope.
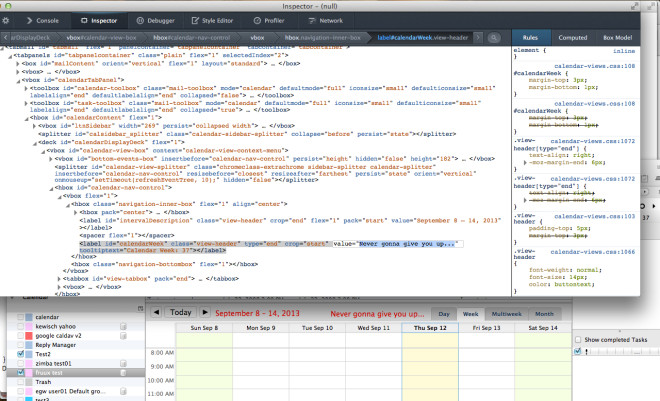
First of all, let me tell you about the remaining features I have implemented since the last post. One of the features is support for the remote inspector. This was pretty easy to do, although support for it is still preliminary. There are still a few quirks, but it’s mostly usable. You can see here I’ve changed an attribute value:
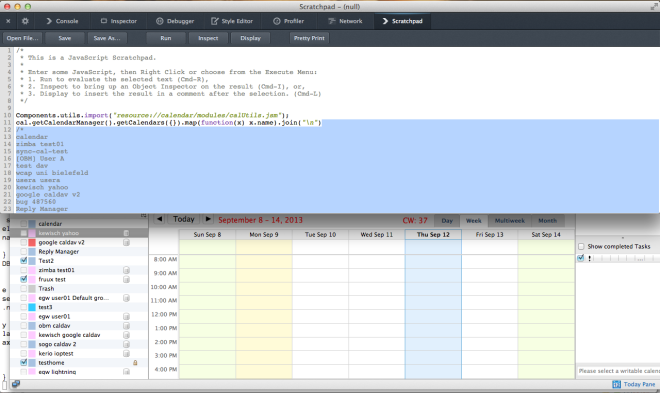
Next up is support for scratchpad, which is still work in progress on the client side but is almost complete. Here is a screenshot:
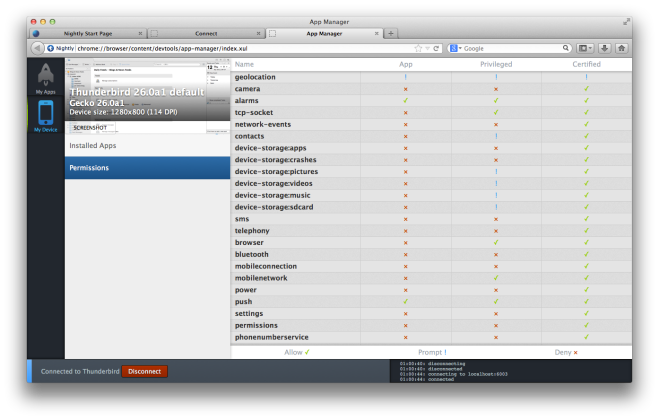
Also, there is the app manager. This is, as far as I’ve understood, still in a beta stadium and aims to be a central place for managing remote devices. Thunderbird is one of these “remote devices”. The app manager shows some information about Thunderbird like its resolution and allows making screenshots:
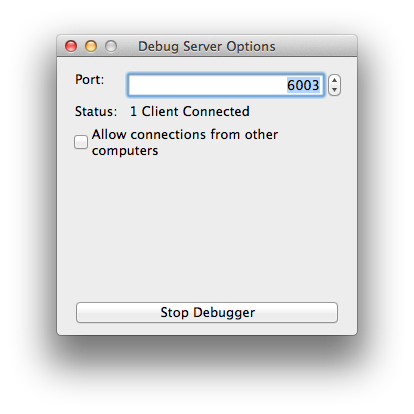
Finally, I’ve made progress packaging the glue code required for the debugger server into an extension. This is mostly a build system change that allows packaging the code as a restartless addon which I can distribute on addons.mozilla.org. The extension has an option dialog which allows starting and stopping the remote connection. From within Thunderbird this extension is not needed, but it is helpful for other applications based on the Mozilla Platform, like those based on XULRunner. I will post an update when the extension is available on addons.mozilla.org. Here is a screenshot of the options dialog:
In my original milestone planning there were a few features considered a bonus. Some of these were not completed. It turns out those extra features are a substantial amount of effort, possibly even worth their own Summer of Code Project.
The first of these two is adding a way to inspect IMAP connections in the network monitor. This requires providing a specific interface in the IMAP channel implementation which makes it possible to inspect the content even after the request has been sent. Also, it is needed to mimic certain aspects of a http channel, specifically the concept of request and response headers. In Thunderbird, the IMAP channel implementation is heavily cached. Hooking up the channel interface to the network monitor would cause display of cached requests as separate requests. Also, this would only fix it for IMAP connections. A better way would be to add a general mechanism in the Mozilla Platform to be able to inspect TCP connections. This requires some changes very deep down in the networking platform and is probably not easy to carry out. I have filed a bug to solve this, but it won’t be a part of the Summer of Code.
The next feature that is missing is gcli, also known as the “Developer Toolbar”, that small black bar you can open in the Web Developer menu that allows executing text commands. The problem here is that the code has a lot of dependencies to Firefox code. A substantial amount of files need to be moved from the directory containing Firefox code to a directory common to all XUL applications. Some files also need to be split up. As this feature is a nice to have, but not considered vital functionality for Thunderbird Developer Tools, we have decided to postpone it. If you see a need for this feature, please leave a comment describing what you want to do with it. In the meanwhile you can follow the bug on bugzilla.
With this I have covered all the features I have proposed, I’d say it was a very successful Summer of Code. I have managed to reduce the code needed in Thunderbird and made most of the changes inside the Developer Tools code. This makes sure that support for Thunderbird will work in the future without needing updates. Also, new remote features will automatically work, given there is no Firefox specific code in them.
If you want to jump right in and try it, I have to appeal to your patience. Some of the patches required for functionality are still in review by my mentor and the Mozilla developer tools team. I will let you know once everything is in place. I’m pretty sure we will able to get all code into the tree by the end of the current cycle.


This was an excellent GSoC project, thank you for all the hard work!
Reblogged this on Keerthi Chandra.
Thank you very much for this. I hope it will help resurrect dying TBird extensions and the creation of new ones. I’ve added it to the list of extension tools at https://developer.mozilla.org/en-US/docs/Setting_up_extension_development_environment.
For folks wanting use this, note that it depends on some patches that have not been applied yet. So until they are you will need to build Thunderbird yourself. See https://bugzilla.mozilla.org/show_bug.cgi?id=876636#c36 for more info. Building Thunderbird is pretty straightforward, see https://developer.mozilla.org/en-US/docs/Simple_Thunderbird_build.
Pingback: GSoC Successes | Hacking for Christ
Pingback: GSoC 2013 Successes | Hacking for Christ
Thanks very much for this work indeed.
With both Fx and Tb v28, I get the following trying to connect, any ideas?
Thu Nov 07 2013 14:23:36
Error: error occurred while processing ‘listTabs: TypeError: aFactories[(intermediate value)] is undefined
Stack: CommonCreateExtraActors@resource://gre/modules/devtools/dbg-server.jsm -> resource://gre/modules/devtools/server/main.js -> resource://gre/modules/devtools/server/actors/root.js:55
RootActor.prototype.onListTabs/ resource://gre/modules/devtools/server/main.js -> resource://gre/modules/devtools/server/actors/root.js:256
resolve@resource://gre/modules/commonjs/sdk/core/promise.js:118
then@resource://gre/modules/commonjs/sdk/core/promise.js:43
then@resource://gre/modules/commonjs/sdk/core/promise.js:153
RootActor.prototype.onListTabs@resource://gre/modules/devtools/dbg-server.jsm -> resource://gre/modules/devtools/server/main.js -> resource://gre/modules/devtools/server/actors/root.js:245
DSC_onPacket@resource://gre/modules/devtools/dbg-server.jsm -> resource://gre/modules/devtools/server/main.js:1019
@resource://gre/modules/devtools/dbg-server.jsm -> resource://gre/modules/devtools/server/main.js -> resource://gre/modules/devtools/server/transport.js:201
@resource://gre/modules/devtools/dbg-server.jsm -> resource://gre/modules/devtools/server/main.js -> resource://gre/modules/devtools/DevToolsUtils.js:75
Source file: resource://gre/modules/devtools/dbg-server.jsm -> resource://gre/modules/devtools/server/main.js
Line: 924
I’m not sure I replied to you on another channel, but in case I didn’t here goes: I recall a bug being filed with a similar error message, I will look into this soon. It looks to me like some actor is not defined, since the value is optimized out its hard to tell just by the error message.
Is there any way to bring up Firefox’s “Web Developer” menu in Thunderbird or more importantly the “Browser Console”?
If so (or not) how would you log to the console in the remote debugger (or a built-in Browser Console)? Trying to work on a TB Extension and finding it very difficult though I have gotten the remote debugger working fine, just trying to get logging working…
Hi Clint,
before times of the browser console, there was the error console. The new browser console mostly holds the same messages, so if you want to see the messages directly in Thunderbird, you can just open the error console.
If you want the developer tools console to work via remote debugging, then you must upgrade to a later version of Thunderbird and use the matching Firefox version. If you take Thunderbird from the beta channel I am sure all tools will be available.
Philipp
Hmm, so I updated to the beta Thunderbird, still no built-in web console, the error console sure is throwing errors though. :) Regardless are you saying that a ChromeWindow.console.log() should log to a remotely connected debug session now?
Definitely aware of the normal error console, but it has virtually no inspection capabilities, which is why I’m trying to get the new web console to work, so I can see what’s going on inside, reflect on objects and view their properties.
I feel like with Mozilla abandoning Thunderbird and plugins deteriorating, it needs some good plugin writers to step in and start helping out. My aim is to do just that, but I’ve been spoiled on the FF plugin development side having access to FireBug/ChromeBug and now the web console. Can’t go back, too painful. :)
Thank you, for your work related to getting remote debugging working w/ Thunderbird.
Anything that is in the error console should be logged to the remotely connected debug session. If you want to send your own messages, you should be able to do so just using console.log() (no ChromeWindow). I’ve just tested this and confirmed the message shows up:
* Connect a remote session from Firefox, open the > Console tab.
* In Thunderbird, open the error console (not for messages, but to run code)
* Enter this: top.opener.console.log({a:”b”});
(It will call console.log on the opening window, which is the TB main window)
* Verify that in the remote debugger session in Firefox the object is inspectable.
Indeed I’ve got it working with the remote debugger console now (on FF 27.01/TB 27.0), Thank You! The top.opener did not work, but ChromeWindow.console.log() did.
Is there any way to keep a debugger connection alive through a TB restart or auto-reconnect? Every time I restart TB I need to close the debugger, open a new one and re-attach. Is there any setting I can use to avoid this? Ideally I’d be able to open the console from within TB its-self (skipping the remote debugging). I had been diving into the code on mxr but saw that the HUDservice wasn’t in the latest release. Wasn’t looking through the beta code though.
Unfortunately there is currently no way to keep the debugger connection alive through a TB restart. There are two related devtools bugs to handle this situation:
https://bugzilla.mozilla.org/show_bug.cgi?id=884330 – debugging startup/reconnecting
https://bugzilla.mozilla.org/show_bug.cgi?id=939379 – Remote developer tools need to be able to reconnect
I might be able to find a workaround until then by implementing this bug (which is easier to do):
https://bugzilla.mozilla.org/show_bug.cgi?id=933720
Then I could add an option that starts Firefox with that option, which would start a js debugger if Firefox is already running. No promises when I’ll get to it though.
Philipp, thank you for your work, no really I mean thank you.